主要屬性:
 //設置柱狀圖大小
                    barWidth: 20,
- 1
- 2
 demo:
demo:
<!DOCTYPE html>
<html>
<head>
<meta charset="utf-8">
<title>柱狀圖大小</title>
<!-- 引入 echarts.js -->
<script src="https://cdn.bootcss.com/echarts/4.2.1-rc1/echarts.min.js" type="text/javascript"></script>
<script src="http://code.jquery.com/jquery-1.8.0.min.js"></script>
</head>
<body>
<!-- 為ECharts準備一個具備大小(寬高)的Dom -->
<div id="main" style="width: 600px;height:400px;"></div>
<script type="text/javascript">
// 基于準備好的dom,初始化echarts實例
var myChart = echarts.init(document.getElementById('main'));
// 指定圖表的配置項和數據
myChart.setOption({
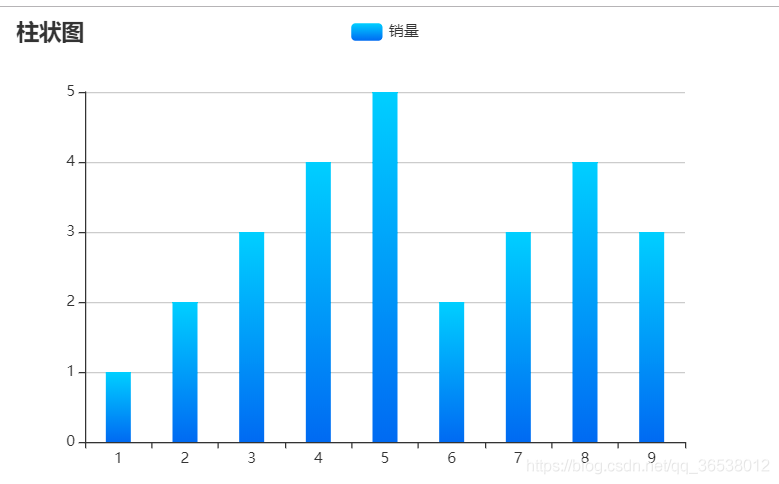
title: {
text: '柱狀圖'
},
tooltip: {},
legend: {
data: ['銷量']
},
xAxis: {
data: ["1", "2", "3", "4", "5", "6", "7", "8", "9"]
},
yAxis: {},
series: [{
name: '銷量',
type: 'bar',
//設置柱狀圖大小
barWidth: 20,
//設置柱狀圖漸變顏色
itemStyle: {
normal: {
color: new echarts.graphic.LinearGradient(0, 1, 0, 0, [{
offset: 0,
color: "#1268f3" // 0% 處的顏色
}, {
offset: 0.6,
color: "#08a4fa" // 60% 處的顏色
}, {
offset: 1,
color: "#01ccfe" // 100% 處的顏色
}], false)
}
},
data: ["1", "2", "3", "4", "5", "2", "3", "4", "3"]
}]
});
</script>
</body>
</html>
- 1
- 2
- 3
- 4
- 5
- 6
- 7
- 8
- 9
- 10
- 11
- 12
- 13
- 14
- 15
- 16
- 17
- 18
- 19
- 20
- 21
- 22
- 23
- 24
- 25
- 26
- 27
- 28
- 29
- 30
- 31
- 32
- 33
- 34
- 35
- 36
- 37
- 38
- 39
- 40
- 41
- 42
- 43
- 44
- 45
- 46
- 47
- 48
- 49
- 50
- 51
- 52
- 53
- 54
- 55
- 56
- 57